Data Science is one of the essential parts of the Information Technology sector. It is has been in more demand for the past few years, and most professionals want to work in this field. Many aspirants are already preparing themselves for a Data Science career, and for them, we have listed the Top 50 Data Science Interview Questions with the following difficulty levels.
- Data Science Interview Questions – General
- Data Science Interview Questions – Intermediate
- Data Science Interview Questions – Expert
1) What skills are necessary for a data scientist? A data scientist needs strong skills in programming (Python, R), data analysis, and machine learning. Expertise in statistics, data visualization, and big data tools, combined with problem-solving and domain knowledge, is essential for impactful insights and solutions.
2) Are coding questions asked in data science interviews?
Yes, coding questions are often asked in data science interviews to evaluate your ability to write efficient algorithms, manipulate data, and implement machine learning models. Proficiency in Python, R, or SQL is typically required for problem-solving tasks.
3) Are data science interviews considered difficult?
Data science interviews are considered challenging due to their focus on diverse skills, including statistical analysis, machine learning, coding, and problem-solving. Candidates must demonstrate technical expertise, business acumen, and the ability to handle real-world data scenarios effectively.
4) Why is data cleaning crucial, and how is it performed?
Data cleaning is crucial as it ensures the accuracy and reliability of machine learning models by removing errors, duplicates, and inconsistencies. It involves handling missing values, correcting data formats, and filtering irrelevant information for optimal analysis and insights.
Data Science Interview Questions – General
Let’s start Data Science Interview Questions with some beginner-level questions that cover basics and foundational knowledge.
5) What is a decision tree?
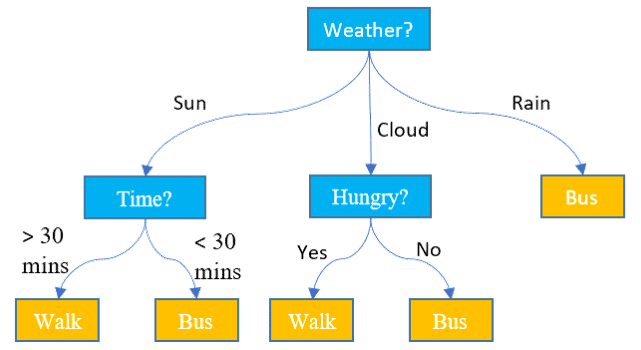
A decision tree is a model used in operations research, machine learning and strategic planning. Each endpoint connected to the branch is called a node, and generally, more nodes result in a more accurate decision. The last nodes of the decision tree are called the leaves of the tree, where a decision is made.
6) What is NLP?

Natural Language Processing, or NLP, is a branch of artificial intelligence that allows machines to read and understand human languages.
7) What is cross-validation?
Cross-validation is the technique used to assess how well a model performs on a new independent dataset.
8) What is statistical power?
![]()
Statistical power refers to the power of a binary hypothesis, the probability that the test will reject the null hypothesis when the alternative hypothesis is true.
9) What is selection bias?
Selection bias is a problematic situation in which error is introduced due to a non-random population sample.
10) What is logistic regression?
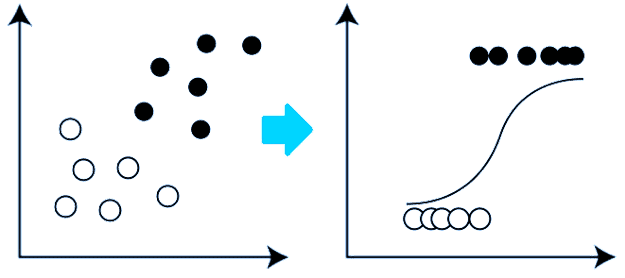
Logistic regression is a technique used to forecast the binary outcome from a linear combination of predictor variables. It is also known as the logit model.
11) Define the term deep learning
Deep Learning is concerned with algorithms inspired by the structure called artificial neural networks (ANN).
12) What is Ensemble Learning?
Ensemble Learning combines a diverse set of learners to improvise the stability and predictive power of the model.
13) What is boosting?
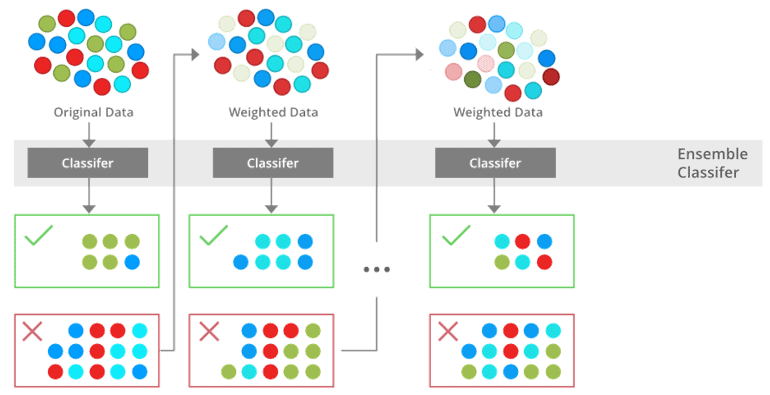
Boosting is one of the ensemble methods to improve a model by reducing its bias and variance, leading to converting weak learners to strong learners. The idea here is to train a weak learner and sequentially iterate and improve the model by learning from the previous learner.
14) What is multicollinearity, and what to do with it?
Multicollinearity is a state when an independent variable is highly correlated with another independent variable in a multiple regression equation. It can be problematic as it undermines the statistical significance of an independent variable.
15) What are recommender systems?
The recommender system is an information filtering system that predicts the preferences or ratings a user would give to a product.
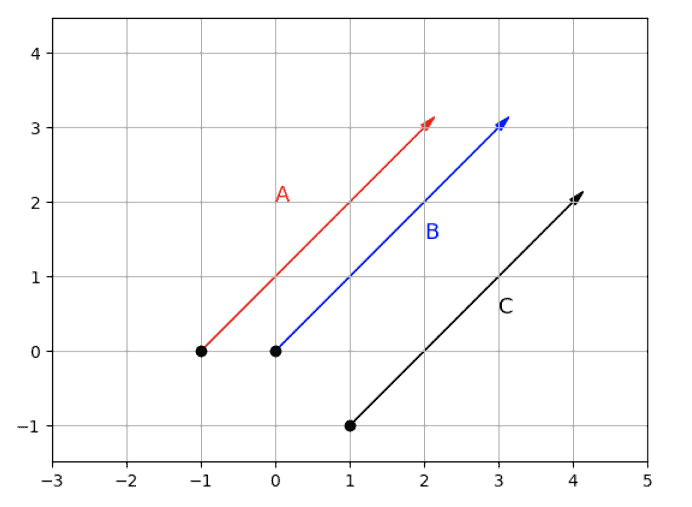
16) What are the feature vectors?
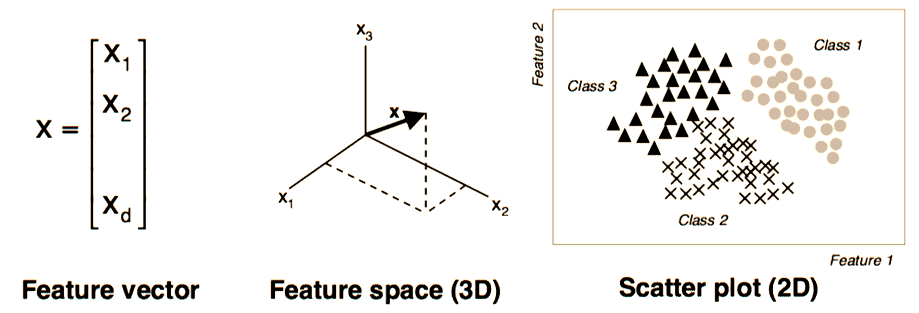
It is an n-dimensional vector for numerical features that represents an object. In ML, feature vectors represent numeric or symbolic characteristics (called features) of an object in a mathematical way that’s easy to analyse.
17) What is collaborative filtering?
It is a method used by most recommender systems for filtering the process to find patterns and information by numerous data sources, collaborating perspectives, and several agents.
18) What is the goal of A/B Testing?
A/B is a statistical hypothesis testing for randomised experiments with two variables (A and B). It is used to detect any changes to a web page to maximise or increase the outcome of a strategy.
19) What is a recall?
It is the true positive rate ratio against the actual positive rate that ranges from 0 to 1.
20 ) What are data science tools?
Data science tools are software and frameworks used for analyzing, visualizing, and modeling data. Popular tools include Python, R, Jupyter Notebooks, Tableau, Power BI, Apache Spark, and TensorFlow, enabling data scientists to extract actionable insights effectively.
21 ) What is survivorship bias?
Survivorship bias is a logical error where conclusions are drawn based on only the survivors or successful examples, ignoring those that failed. This bias skews analysis, leading to flawed insights and decisions in data interpretation and problem-solving.
Data Science Interview Questions – Intermediate
Now comes Data Science Interview Questions of intermediate level that will cover some in-depth concepts.
22) What are the differences between supervised and unsupervised learning?
| Supervised Learning | Unsupervised Learning |
|---|---|
|
|
|
|
|
|
23) Why is dimension reduction significant?
It is the process of reducing the number of features in a dataset. Dimension Reduction is important mainly when you want to reduce variance in your model (overfitting).
24) What is the law of large numbers?
It is the theorem that forms the basis of frequency-style thinking. It describes the outcome of performing the same experiment very frequently. It also states that the sample variance, the sample mean and sample standard deviation converge to what is estimated.
25) What is Prior probability and likelihood?
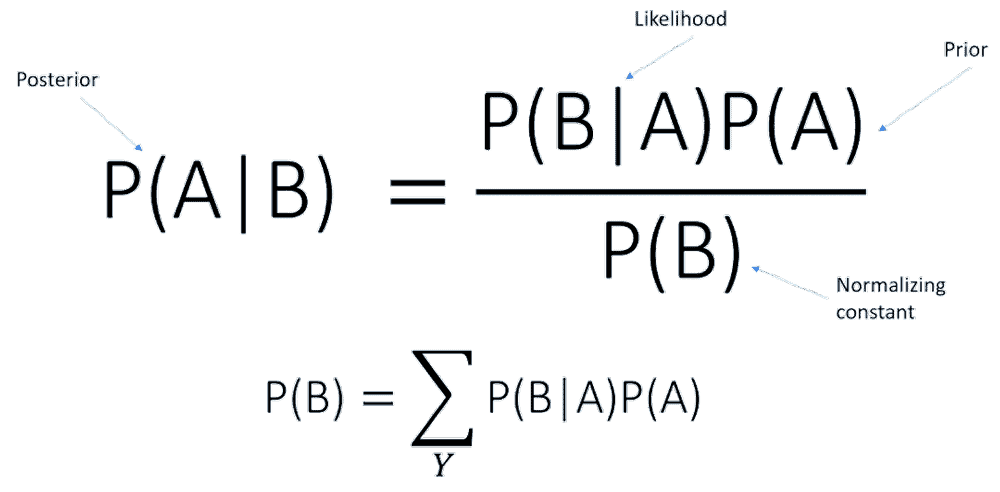
- Prior Probability is the ratio of the dependent variable in a data set.
- The likelihood is the probability of a given observant in the presence of some other variable.
26) What is Back Propagation?
It is the way of tuning the weights of a neural net depending upon the error rate obtained in the previous epoch.
27) What are the confounding variables?
Confounding variables are the extraneous variables in a statistical model that correlates directly or inversely with the dependent and independent variables.
28) Explain cluster sampling technique in Data science
It is a method used when it is challenging to study the target population spread across, and simple random sampling can’t be applied.
29) Do gradient descent methods always converge to similar points?
No, because they reach a local minima or a local optima point in some cases. Also, the global optima point is not reached. The data and the starting conditions govern this.
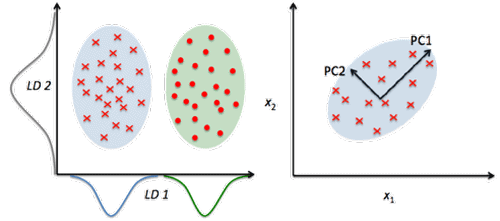
30) What is principal component analysis?
PCA or Principal Component Analysis involves project higher dimensional data (e.g. 3D) to a smaller space (e.g. 2D). It results in a lower dimension of data (2D instead of 3D) while keeping all original variables in the model.
31) What is mean imputation of missing data acceptable?
It is the practice of replacing the null values in a data set with the mean of the data.
32) Which language is best for text analytics? R or Python?
For text analytics, Python will be more suitable as it consists of a rich library known as pandas. It also allows you to use high-level data analysis tools and data structures, whereas R doesn’t offer this feature.
33) Why is MSE (Mean Square Error) a bad measure of model performance? What would you suggest instead?
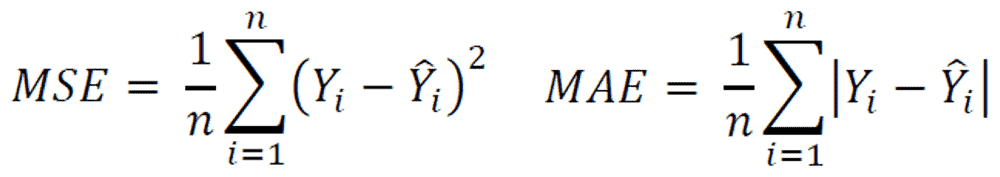
MSE or Mean Squared Error gives a relatively high weight to significant errors. Therefore, it tends to put too much emphasis on large deviations. MAE (mean absolute deviation) is a more robust alternative.
34) What are Auto-Encoders?
Autoencoders are learning networks that help you to transform inputs into outputs with a few errors. In other words, you will get output to be as close to input as possible.
35) Discuss Artificial Neural Network.
ANN or Artificial Neural network has revolutionised machine learning. ANN is a unique set of algorithms that helps you to adapt the result with the changing input so the network can generate the best possible result without redesigning the output criteria.
36) Name various types of Deep Learning Frameworks.

37) Name commonly used algorithms?
The four most used algorithms by Data scientists are:
- Linear regression
- Logistic regression
- Random Forest
- KNN
38) What are the disadvantages of using a linear model?
The Three disadvantages of the linear model are:
- It cannot be used for binary or count outcomes
- The assumption of linearity of the errors.
- Plenty of overfitting problems cannot be solved.
39) What is the difference between convex and non-convex cost functions?
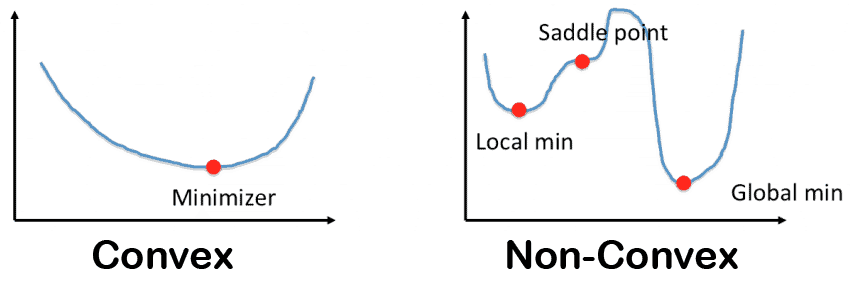
- A convex function is a line drawn between any two points on the graph that lies on or above the graph. It has one minimum point.
- A non-convex function is a line drawn between any two points on the graph that may intersect other points. It is characterized as “wavy”.
40) What is a univariate analysis?
An analysis that is applied to none attribute at a time is known as univariate analysis. Boxplot is a widely used, univariate model.
41) Explain Collaborative filtering
Collaborative filtering is used to search for correct patterns by collaborating viewpoints, multiple data sources, and various agents.
42) When underfitting occurs in a static model?
It occurs when a machine learning algorithm or statistical model cannot capture the underlying trend of the data.
43) Overfitting Vs Underfitting
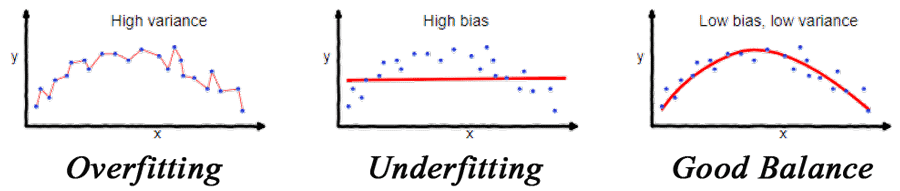
- Model is underfitting the training data when the model cannot capture the relationship between the input (X) and target (Y) values and thus performs poorly on the training data.
- Model is overfitting the training data when the model performs well on the training data but not on the evaluation data.
44)What are the top 3 technical skills of a data scientist?
The top technical skills are programming (Python, R), statistical analysis, and machine learning model building and evaluation.
45)What are the model parameters used to build ML models using iterative methods under model-based learning methods?
Parameters like weights, biases, and learning rates are optimized iteratively using algorithms such as gradient descent.
46)Are coding questions asked in data science interviews?
Yes, coding questions, often involving Python, R, or SQL, are commonly asked to test technical and problem-solving skills.
47)What is imbalanced data, and why is it a problem?
Imbalanced data occurs when class distributions are unequal, leading to biased predictions and poor model generalization.
48)What are Eigenvectors and Eigenvalues, and how are they used in machine learning?
Eigenvectors and eigenvalues are used in PCA for dimensionality reduction and in understanding linear transformations.
49)How does the grid search parameter differ from the random search tuning strategy?
Grid search exhaustively tests parameter combinations, while random search samples parameters randomly, often saving time.
50)What are the assumptions used in linear regression, and what happens if they are violated?
Assumptions include linearity, independence, homoscedasticity, and normality of residuals. Violations can lead to biased or invalid results.
60)What is the difference between the test set and validation set?
The validation set is used for hyperparameter tuning, while the test set evaluates the final model performance.
61)What is the bias-variance trade-off in machine learning?
It’s the balance between underfitting (high bias) and overfitting (high variance) to achieve optimal model generalization.
62)Does overfitting more likely occur when there is a huge data amount to train?
No, overfitting is more likely with limited data or overly complex models, not large datasets.
63)Is it beneficial to perform dimensionality reduction before fitting a Support Vector Model?
Yes, it reduces noise and computational cost, improving SVM performance for high-dimensional data.
64)What is the kernel trick in machine learning?
The kernel trick enables non-linear decision boundaries by mapping data into higher-dimensional spaces without explicit transformations.
65)What are the differences between correlation and covariance?
Correlation measures the strength of a linear relationship, while covariance measures how two variables vary together.
66)Why is TensorFlow considered a preferred library in deep learning?
TensorFlow offers scalability, efficient computation, and extensive community support, making it ideal for building complex deep learning models.
67)What are exploding gradients and vanishing gradients in neural networks?
Exploding gradients cause unstable updates, while vanishing gradients lead to slow learning, especially in deep networks.
68)What is a computational graph in the context of deep learning?
A computational graph is a directed acyclic graph representing operations and dependencies for efficient computation.
69)What is a Generative Adversarial Network (GAN)?
GANs consist of a generator and discriminator working adversarially to produce realistic synthetic data.
70)What are support vectors in a Support Vector Machine (SVM)?
Support vectors are the data points closest to the decision boundary, influencing its position and orientation.
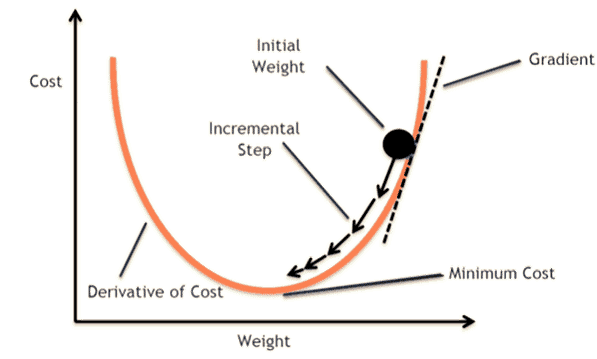
71)What is a gradient, and what is gradient descent?
A gradient represents the slope of a function, and gradient descent is an optimization algorithm minimizing model error.
72)What is the p-value, and what does it indicate in the context of the null hypothesis?
The p-value quantifies evidence against the null hypothesis, with smaller values indicating stronger evidence.
73)How are time series problems different from other regression problems?
Time series data has temporal dependencies, requiring models to account for trends, seasonality, and autocorrelation.
74)When are both false positives and false negatives equally important?
They are equally important in scenarios like medical testing, where both misdiagnoses and missed diagnoses have severe consequences.
75)How do box plots and histograms differ in data visualization?
Box plots summarize data distribution using quartiles, while histograms visualize the frequency of data intervals.
76)How often should algorithms be updated in machine learning?
Algorithms should be updated when data patterns change, such as in seasonal trends or evolving user behavior.
77)Are there differences between the expected value and mean value?
The expected value is theoretical, while the mean value is empirical, derived from observed data.
78)How do you identify if a coin is biased?
Conduct a hypothesis test comparing observed outcomes to the expected probabilities of a fair coin.
79)When is resampling done in data analysis?
Resampling is used for bootstrapping, cross-validation, or addressing class imbalance in datasets.
80) How do you differentiate between long and wide format data?
Long format organizes data in rows for each observation, while wide format stores variables as separate columns.
81 )What are the definitions of KPI, lift, model fitting, robustness, and DOE?
KPI: Key Performance Indicator.
Lift: Measure of model effectiveness.
Model Fitting: Adjusting parameters to data.
Robustness: Model resilience to variations.
DOE: Design of Experiments for testing variables.
82) How is the probability of events calculated using the example of shooting stars?
Divide the number of observed shooting stars by the total observation time or events.
83 ) How do you calculate a 3-month simple moving average for February 2021, given specific monthly demand data?
Add the demand for December 2020, January 2021, and February 2021, then divide by 3.
Data Science Interview Questions – Expert
Now, the Data Science Interview Questions of advanced level are covered with a more in-depth knowledge of data science.
84) Explain Confusion Matrix.
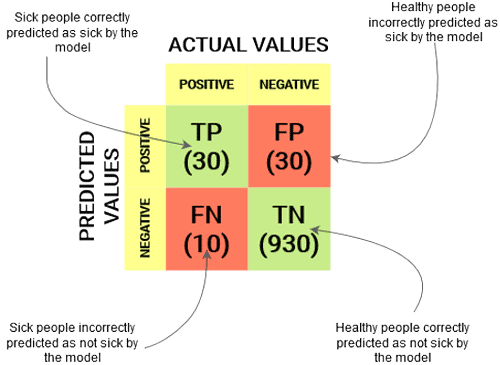
Confusion Matrix summarises the performance of the classification algorithm.
85) Calculate the precision and recall rate for the above confusion matrix.
- Precision Rate = (True positive) / (True Positive + False Positive) = 30/(30+30) = 30/60 = 0.50
- Recall Rate = (True Positive) / (True Positive + False Negative) = 30/(30+10) = 30/40 = 0.75
86) Calculate the accuracy rate for the above confusion matrix.
Accuracy = (True Positive + True Negative) / Total Observations
= (30+930)/(30+30+10+930)
=960/1000
=0.96
87) Treating a categorical variable as a continuous variable would result in a better predictive model? Explain.
Yes, the categorical value is considered as a continuous variable only when the variable is ordinal. So it is a better predictive model.
88) Is it possible to capture the correlation between continuous and categorical variables?
Yes, we can use the analysis of covariance technique to capture the association between continuous and categorical variables.
89) How can you select k for k-means?
- To select k for k-means clustering, use the elbow method. It runs k-means clustering on the data set where ‘k’ is the number of clusters.
- Use Within the Sum of Squares or WSS that is defined as the sum of the squared distance between every member of the cluster and its centroid.
90) In a study of population behaviour, you want to find all users who are most similar to the four individual types that are valuable for your study. Which algorithm will be more appropriate to use for this study?
The most appropriate algorithm for this study would be k-means clustering, as we need to group people based on four different similarities that indicate the value of k.
91) Why is Naive Bayes so bad? How would you improve a spam detection algorithm that uses naive Bayes?
- One of the significant drawbacks of Naive Bayes is that it holds a strong assumption that the features are uncorrelated with each other, which generally is never the case.
- One way to improve an algorithm that uses Naive Bayes is by decorrelating the features so that the assumption holds true.
92) What is the Central Limit Theorem? Explain it. Why is it important?
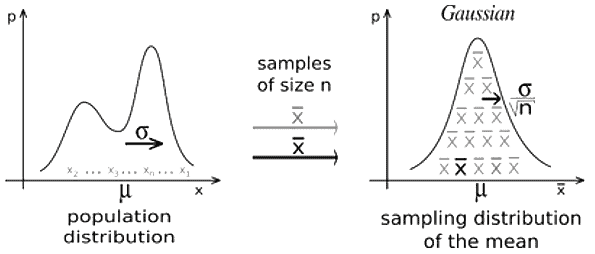
- According to the theorem, the sampling distribution of the sample mean reaches a normal distribution when the sample size gets larger without taking into effect the shape of the population distribution.
- It is essential as it is used in hypothesis testing and to calculate confidence intervals.
93) How to check if the regression model fits the data well?
- R-squared/Adjusted R-squared: Relative measure of fit.
- RMSE: Absolute measure of fit.
- F1 Score: It evaluates the null hypothesis (all regression coefficients are equal to zero) vs the alternative hypothesis (at least one doesn’t equal zero).
94) Do you think 50 small decision trees are better than a large one? Why? OR Is a random forest a better model than a decision tree?
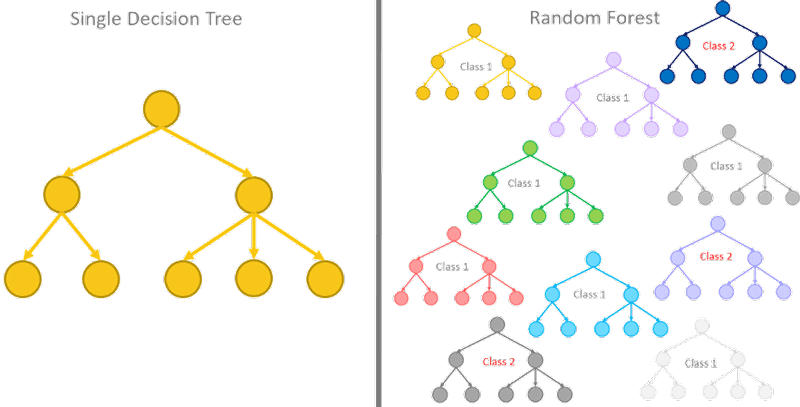
Yes, A random forest is an ensemble method that takes many weak decision trees to make a strong learner. Random forests are more robust, more accurate, and less prone to overfitting.
95) How can you avoid overfitting your model?
It refers to a model that is only set for minimal data and ignores the bigger picture. To avoid overfitting, there are three main methods.
- Cross-validation techniques, such as k folds cross-validation
- Keep the model simple – Removing the noise in the training data by Taking fewer variables into account.
- Use regularisation techniques, such as LASSO. It penalises specific model parameters if they cause overfitting.
96) How do you handle missing data? What imputation techniques do you recommend?
Some ways to handle missing data are:
- Mean/Median/Mode imputation
- Delete rows with missing data
- Assigning a unique value
- Predicting the missing values
- Using an algorithm that supports missing values, like random forests
97) What does the ROC curve represent, and how is it created?
The ROC curve represents the trade-off between true positive and false positive rates across various threshold values. It is created by plotting sensitivity (TPR) against 1-specificity (FPR) for different classification thresholds.
98) How should one handle a dataset with variables having more than 30% missing values?
Variables with more than 30% missing values are often removed, but domain knowledge is key. Alternatively, advanced imputation techniques like KNN or predictive modeling can be used, depending on the importance of the variable.
99 ) How should one approach solving a data analytics-based project?
Start with problem definition, followed by data collection, cleaning, and exploration. Perform feature engineering, model building, and evaluation. Finally, interpret and present findings to stakeholders for actionable insights.
100) What is the difference between data analytics and data science?
Data analytics focuses on analyzing historical data for insights, while data science involves advanced techniques like machine learning and predictive modeling to create future-focused solutions.
101) What defines the analysis of data objects not complying with general data behavior?
This is referred to as outlier analysis, where anomalous data points that deviate significantly from the norm are identified and analyzed for potential insights or issues.
102) Is Python and SQL enough for data science?
Python and SQL cover most foundational needs in data science, like data manipulation, querying, and machine learning. However, additional tools like R, Spark, or Tableau may be required for specific advanced tasks.
103) When is a false positive more important than a false negative?
False positives are critical in scenarios like spam email detection, where mistakenly marking a legitimate email as spam can cause loss of important communication.
104 )How would you handle training a model on data that exceeds available RAM capacity?
Use techniques like data sampling, distributed computing frameworks (e.g., Hadoop, Spark), or incremental learning algorithms that process data in chunks.
105 )What does it mean when p-values are high and low?
A high p-value indicates weak evidence against the null hypothesis, suggesting no significant effect, while a low p-value implies strong evidence against the null, indicating statistical significance.
106) How do you estimate the probability of getting a head in a coin toss after observing 10 heads?
Use Bayesian inference to estimate the probability. With a uniform prior, the posterior probability is calculated using the Beta distribution based on observed heads and tails.
107) Which among the below is NOT a necessary condition for weakly stationary time series data?
A non-necessary condition is that the series must have a periodic trend. Stationarity requires constant mean, variance, and autocovariance over time, not periodicity.
108) Which method depicts hierarchical data in a nested format?
A dendrogram is commonly used to represent hierarchical data in a nested tree-like structure, often used in hierarchical clustering.
109) How can you calculate the probability of seeing a shooting star within a given timeframe?
Use the Poisson distribution, which models the probability of a certain number of events occurring within a fixed interval of time or space.
110)What does a linear equation having 3 variables represent?
A linear equation with three variables represents a plane in 3D space, where any solution lies on this plane.
111) What would be the formula representation of a problem involving the price of 2 pens and 1 pencil as 10 units?
The formula can be represented as
2𝑃+1𝐶=10
2P+1C=10, where 𝑃
P is the price of a pen and 𝐶
C is the price of a pencil.
Conclusion
Data Science has played a crucial role in the Information Technology sector. Most professionals seek careers in Data Science and prepare themselves for the challenges to get selected in the Interview. Thus, we listed the Top 50 Data Science Interview Questions on a few best topics in different difficulty levels. All these questions will surely help you in the Data Science Interview.
Related/References:
- Join Our Generative AI Whatsapp Community
- Azure AI/ML Certifications: Everything You Need to Know
- Azure GenAI/ML : Step-by-Step Activity Guide (Hands-on Lab) & Project Work
- [DP-100] Microsoft Certified Azure Data Scientist Associate: Everything you must know
- Microsoft Certified Azure Data Scientist Associate | DP 100 | Step By Step Activity Guides (Hands-On Labs)
- Azure Machine Learning Service Workflow: Overview for Beginners
- Automated ML In Azure
- Data Science VS Data Analytics VS Data Engineer
Next Task: Enhance Your Azure AI/ML Skills